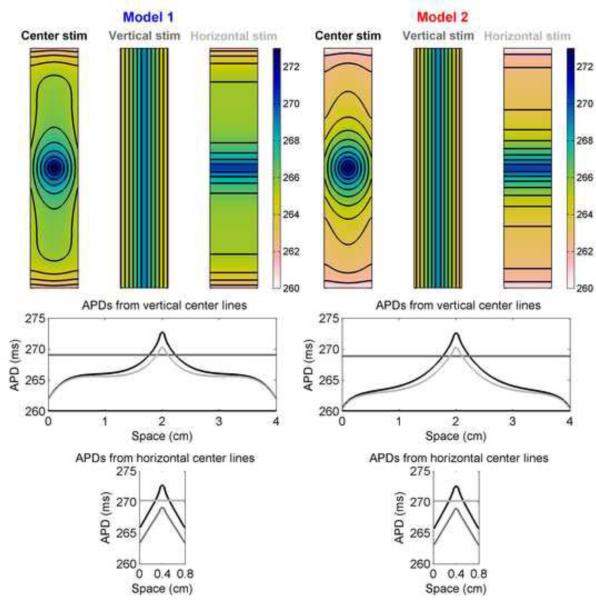
Figure 11.
APD distributions in a 0.75 cm × 4 cm rectangle as a function of stimulus location using Models 1 and 2. Top row shows APD distributions obtained from center, vertical strip, and horizontal strip stimuli. Isochrones are 1 ms apart. Bottom rows show the spatial distribution of APDs along vertical and horizontal lines through the centers of the rectangles. Colorbars indicate ms.

