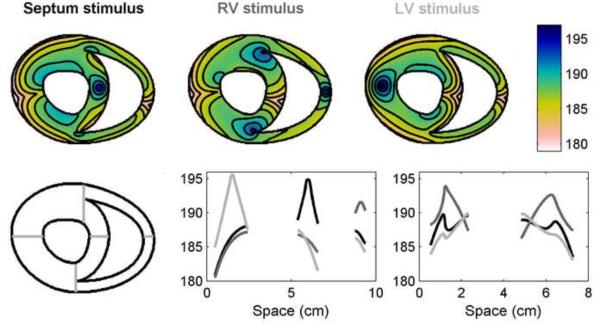
Figure 13.
Spatial distribution of APDs in a two-dimensional slice of a canine ventricular anatomy using the FMG model. Top row shows APDs throughout the slice with stimuli located in the septum (left, black), right ventricle (RV, center, dark gray), and left ventricle (LV, right, light gray; stimulus site corresponds to the site of maximum APD. Isochrones are 2 ms apart. Bottom row shows the APDs along a horizontal line through the center of the slice (center) and through two separate vertical lines through the anterior and posterior regions where the right ventricular chamber terminates (right). The positions of the horizontal and vertical lines within the slice are indicated on the left. Colorbars indicate ms.

