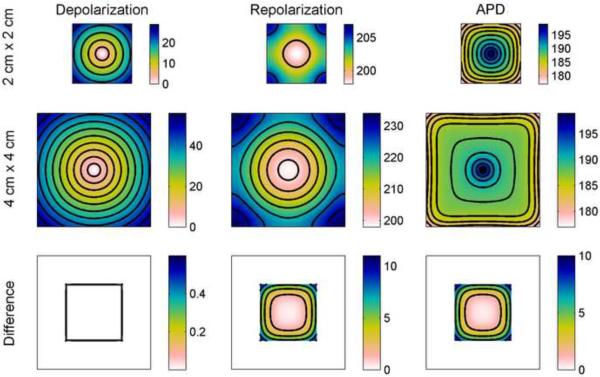
Figure 2.
Spatial distribution of APD in the FMG model in a square geometry. Depolarization and repolarization times (with isochrones 5 ms apart) are shown along with APD (with lines of equal APD 2 ms apart) (all units are ms). Note that all depolarization and repolarization figures panels show isochrones, but in the APD panels the lines represent lines of equal APD. Top row shows data from a 2 cm × 2 cm square and middle row shows data from a larger 4 cm × 4 cm square. Bottom row shows the differences obtained by subtracting the data from the smaller square from the data of the central 2 cm × 2 cm portion of the larger square and indicate a decrease in repolarization time, and consequently in APD, of as much as 10 ms imposed by the boundaries of the smaller square. Isochrones for the difference are 0.2 ms apart for the depolarization difference and 2 ms apart for repolarization and APD differences. Colorbars indicate ms.

