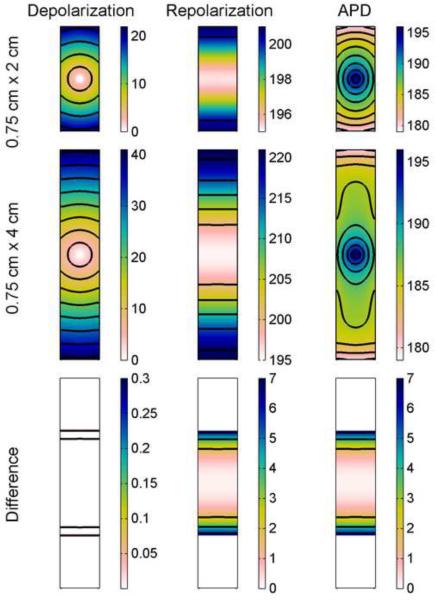
Figure 4.
Spatial distribution of APD in the FMG model in a rectangular geometry. Depolarization and repolarization times (with isochrones 5 ms apart) are shown along with APD (with isochrones 2 ms apart) (all units are ms). Top row shows data from a 0.75 cm × 2 cm rectangle and middle row shows data from a larger 0.75 cm × 4 cm rectangle. Bottom row shows the differences obtained by subtracting data of the smaller rectangle from data from the central 0.75 cm × 2 cm portion of the larger rectangle and indicate a decrease in repolarization time, and consequently in APD, of as much as 7 ms imposed by the boundaries of the smaller rectangle. Isochrones for the difference are 0.2 ms apart for the depolarization difference and 2 ms apart for repolarization and APD differences. Colorbars indicate ms.

