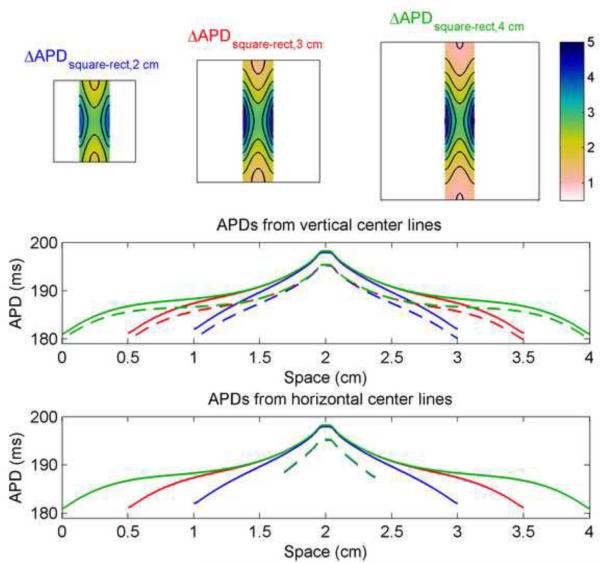
Figure 5.
Differences in APD between square and rectangular geometries in the FMG model. All rectangles are 0.75 cm wide. Top row shows the differences obtained by subtracting data from rectangles 2 cm, 3 cm, and 4 cm long from data of the central portion of 2 cm × 2 cm, 3 cm × 3 cm, and 4 cm × 4 cm squares, respectively, and indicate a decrease in APD of as much as 5 ms imposed by the boundaries of the rectangle. Isochrones are 0.5 ms apart. Bottom rows show the spatial distribution of APDs along vertical and horizontal lines through the centers of the squares (solid) and rectangles (dashed). Colorbars indicate ms.

