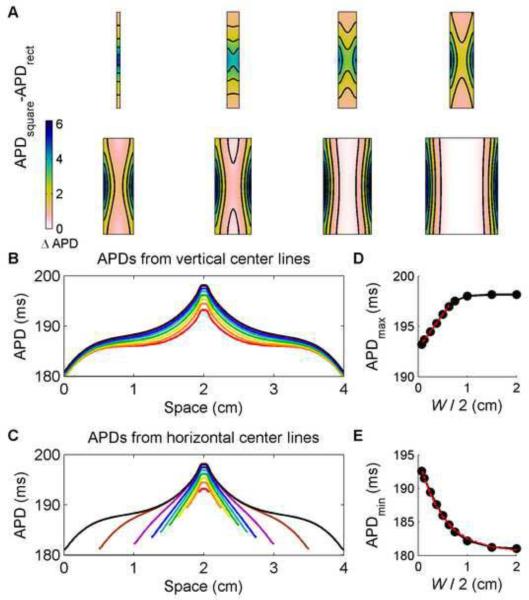
Figure 7.
Differences in APD between square and rectangular geometries of varying widths using the FMG model. A. Differences obtained by subtracting data from rectangles of 8 different widths (0.15, 0.5, 0.75, 1, 1.25, 1.5, 2, and 3 cm) from data from the central portion of a 4 cm × 4 cm square. B. Spatial distribution of APDs along vertical lines through the centers of the rectangles and square. C. Spatial distribution of APDs along horizontal lines through the centers of the rectangles and square. D. Maximum APD values from the rectangles (obtained at the stimulus site) as a function of width. For short widths W, the maximum APD follows a linear function of the distance from the stimulus site (W/2). The maximum APD saturates to a constant value for larger widths. E. Minimum APD values from the rectangles (obtained at the left and right boundaries) as a function of width. The minimum APD values are well approximated by an exponential function of the distance from the stimulus site W/2. Colorbars indicate ms.

