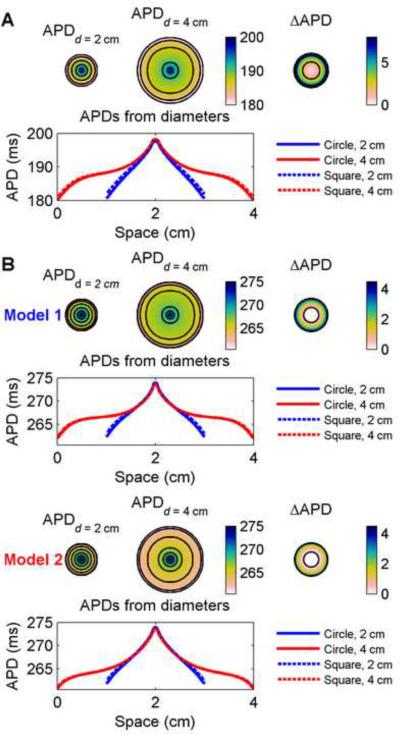
Figure 8.
Spatial distribution of APDs in a circular geometry for (A) the FMG model and for (B) Model 1 and Model 2. APDs are shown for circles 2 cm and 4 cm in diameter (isochrones are 4 ms and 2 ms apart for (A) and (B), respectively). Top right shows the difference obtained by subtracting data from the smaller circle from data from the central 2 cm-diameter circle of the larger circle and indicate a decrease in APD of as much as 8 ms for the FMG model and more than 4 ms for Models 1 and 2 imposed by the boundaries of the smaller circle (isochrones 4 ms apart). Bottom rows show the spatial distribution of APDs along a horizontal diameter of the circles and indicate the influence of boundaries. For comparison, data from horizontal lines through the centers of 2 cm × 2 cm and 4 cm × 4 cm squares are shown (dashed) and indicate the small but observable influence of the corners of the squares. Model 1 and Model 2 show different spatial profiles because of different electrotonic effects. Colorbars indicate ms.

