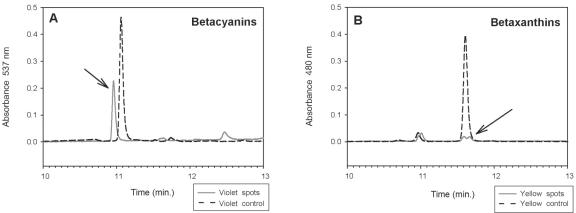
Figure 7.
HPLC analysis of betalain pigments extracted from violet-(A) and yellow-transformed (B) cells in the white P. grandiflora background. These pigments were identified by comparing their elution profile with elution profile of the pigments extracted from violet and deep yellow P. grandiflora petals, respectively. Arrows indicate the major peaks of the violet betanin (A) and of the yellow dopaxanthin (B). The minor 3-s shift observed between the two betanin peaks is due to a slight inaccuracy of the injection process.

