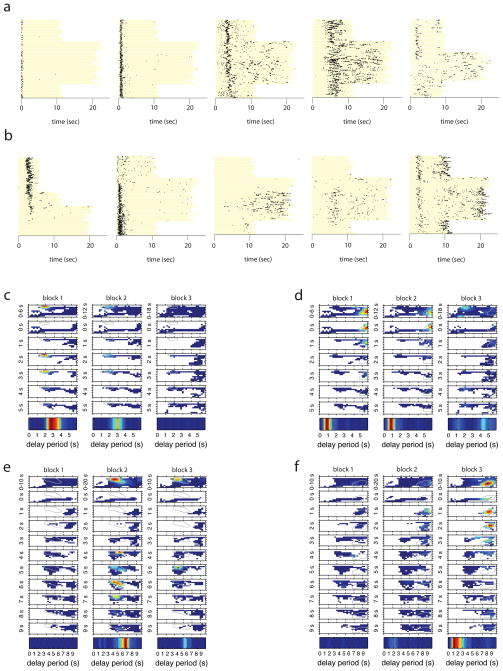
Figure 6.
Neurons maintain their timing or “re-time” when the length of the Delay is abruptly changed. (a, b) Raster plots showing spiking activity from five different neurons referenced to the beginning of the Delay (entire period shown in yellow bars).
(a) Cells that fire at the same time during initial and changed Delays (left 4 panels) and a cell that scaled its timing (right-most panel). (b) Cells that “re-time” when the Delay is increased. (c–f) Spatial firing rate maps during the Delay across successive trial blocks. The format for each trial block is the same as in Figure 5.

