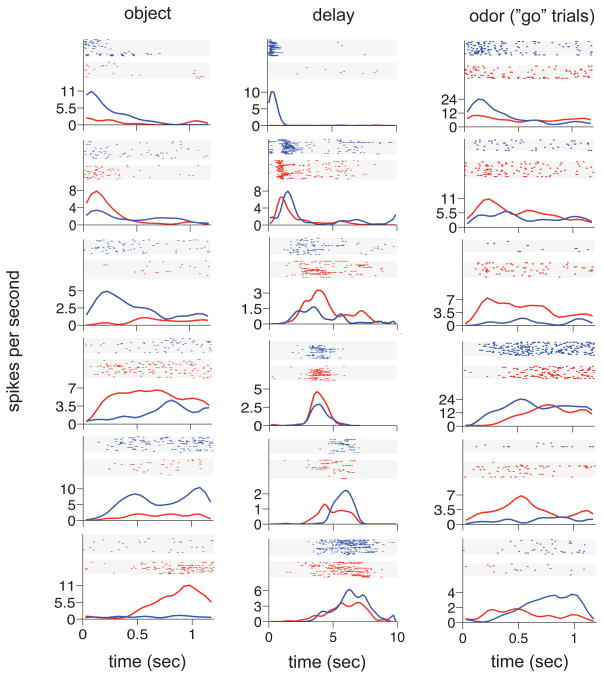
Figure 7.
Neurons distinguish trial event sequences. Similar to the format of Figure 2, each panel includes a raster plot and PSTH from a neuron active during one of the trial periods for all correct trials. The data from are separated according to whether Object 1 (blue) or Object 2 (red) began the trial sequence.

