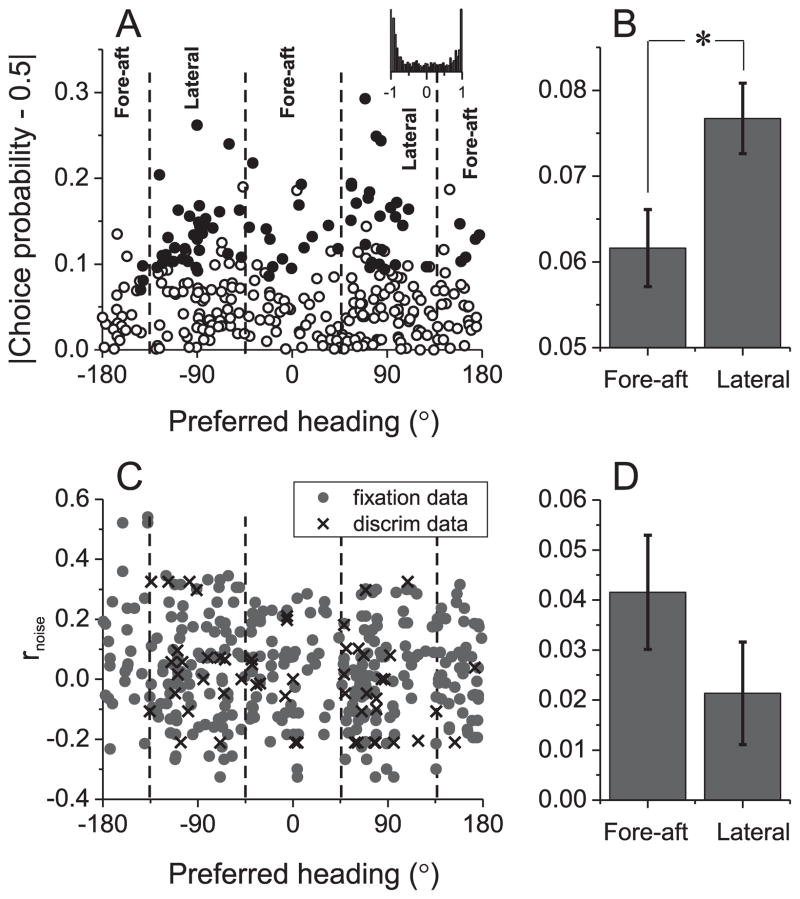
Figure 8.
Relationships between choice probability, noise correlation, and heading preferences in MSTd. (A) Choice probability tends to be more deviated away from the chance level of 0.5 for neurons with lateral heading preferences. Filled symbols denote choice probabilities significantly different from 0.5 (p<0.05, permutation test). Dashed lines denote category boundaries for lateral and fore-aft cells. Inset: distribution of expected signal correlations when heading preferences are drawn randomly from cells with significant choice probabilities. (B) Mean±S.E.M of the choice probability data from (A), sorted into groups for lateral and fore-aft neurons (*, p < 0.05). Data were collected from previous experiments conducted with a single electrode (n=311), and pooled across vestibular and visual conditions. (C) Noise correlations did not depend significantly on heading preference. Pairs of cells denoted by gray circles and crosses were recorded during fixation (n=328) and discrimination tasks (n=55), respectively. For each pair, the noise correlation is plotted twice, at the preferred heading of each neuron. (D) Mean±S.E.M of the noise correlation data from (C).

