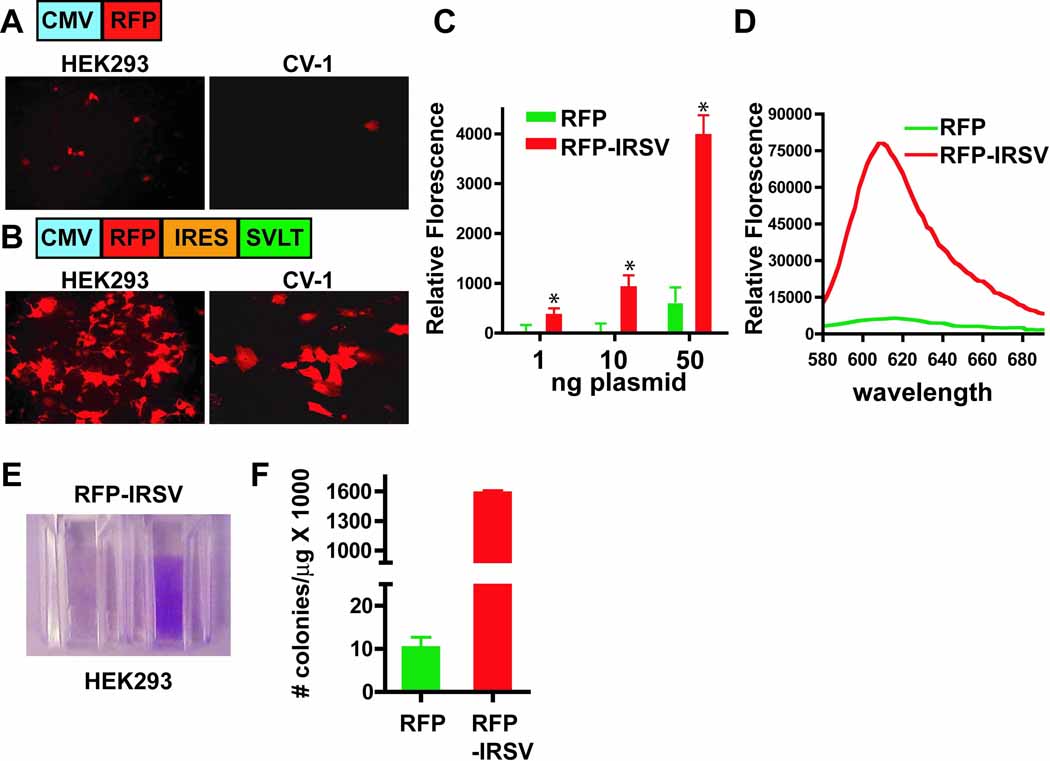
Figure 2.
Comparative RFP protein expression analysis in the absence and presence of the IRES-SVLT element. HEK293 cells (40 ng; left panels) or CV-1 cells (200 ng; right panels) were transiently tranfected in chamber slides using a standard pcDNA3.1 RFP vector (A) or the vector bicistronically linking RFP and SVLT expression via the IRES element (B). Confocal images of RFP expression using the same laser intensity and gain within each cell type are shown. Images are representative from at least three independent experiments. (C) HEK293 cells were transfected with either the standard RFP vector (RFP; green bars) or the IRES-SVLT containing vector (RFP-IRSV; red bars) with the indicated amounts of plasmid in black 96-well plates. Relative florescence was determined using a florescence plate reader (* p < 0.01; mean±s.d.; n=6). For each plasmid amount, RFP-IRSV was significantly greater than the RFP alone vector using the Student’s t-test (*p< 0.01). (D) 10 cm dishes of HEK293 cells were transfected (8 µg/dish) with either the RFP vector (green line) or the RFP-IRSV vector (red line). Cells were lifted from the plate and an emission scan for RFP expression was performed, as described in the Materials and Methods section. (E) Photographic image of cells from (F) HEK293 cells were transiently transfected with either 3.1-RFP or 3.1-RFP-IRSV and the number of colonies per µg of transfected DNA is shown (mean±s.d.; n=6) using the Hirt supernatant extraction method as described in the Materials and Methods section.

