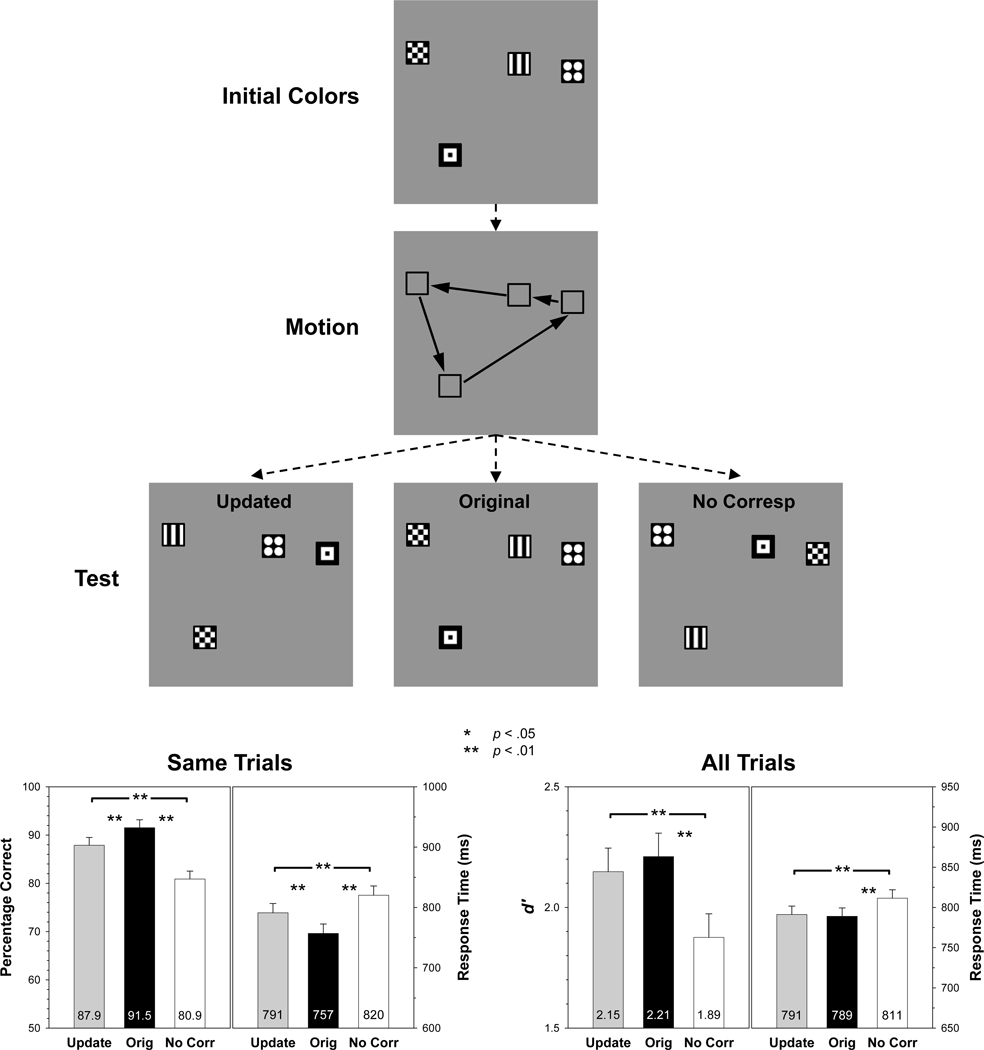
Figure 2.
Top panels. Illustration of the method and correspondence conditions in Experiment 1. Bottom panels. Accuracy and RT data as a function of correspondence condition for same trials alone (left) and all trials (right). Error bars in this and in subsequent figures are 95% confidence intervals based on the error term of the correspondence effect.

