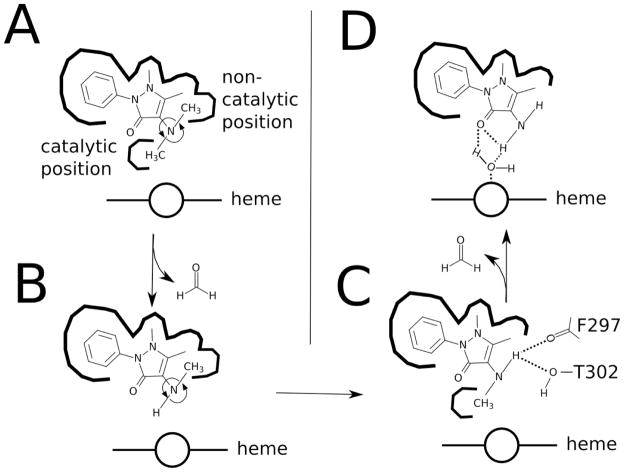
Scheme 2.
Cartoon model of AP metabolism. The diagram shows A) AP, B) DMAP in a catalytically-inactive position, C) DMAP in a catalytically-active position and the product AAP. The thick lines denote hydrophobic crevasses and pockets of P450 2B4, while dashed lines are hydrogen bonds between residues of P450 2B4 and DMAP. The catalytic and non-catalytic positions of the methyl are labeled in A). The heme is labeled and is shown as a circle and a line.

