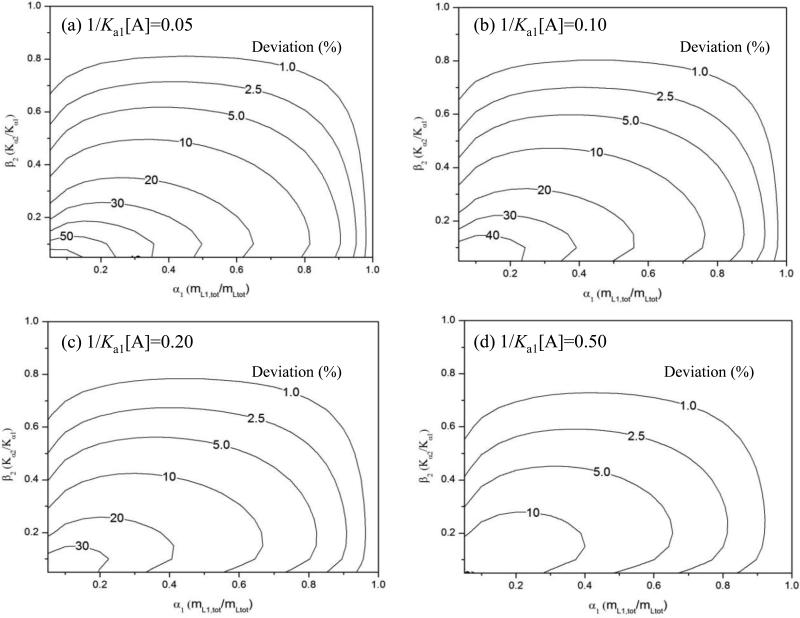
Figure 3.
Contour plots showing the relative deviation from a linear response in the value of mLtot/mLapp for a double-reciprocal frontal analysis plot, as predicted by eq. (10) for two-site systems at various values of 1/(Ka1[A]) and as a function of the mole fraction of the highest affinity site (α1) and the ratio of affinities (β2) for the binding sites in the column. These contour plots were generated by using surface plots like the one shown in Figure 2. These plots are for 1/(Ka1[A]) values of (a) 0.05, (b) 0.10, (c) 0.20 or (d) 0.50 and have contours that range from 1.0% deviation to 10-60% deviation.

