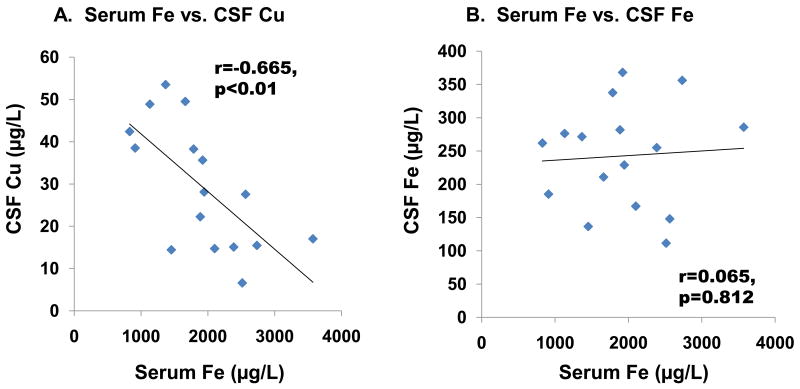
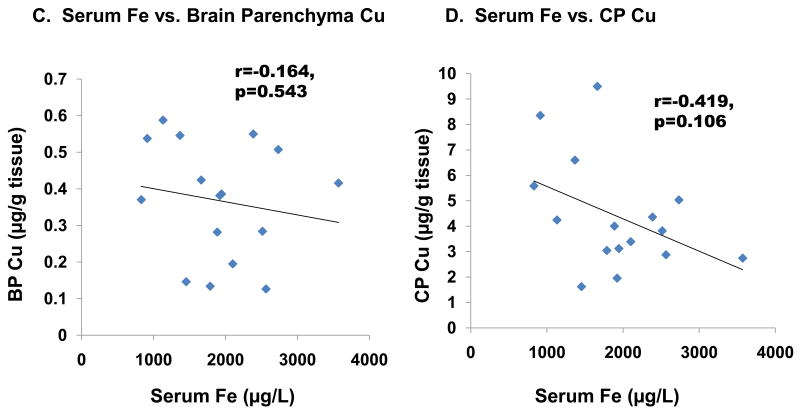
Fig. 4. Changes in CSF Cu, CSF Fe, choroid plexus Cu, and brain parenchyma Cu as a function of serum Fe levels.
Animal treatment is described in the legend to Fig. 1. Data were analyzed by linear regression. (A) Cu in CSF (r=-0.665, p<0.01). (B) Fe in CSF (r=-0.226, p=0.367). (C) Cu in the CP (r=-0.419, p=0.106). (D) Cu in brain parenchyma (r=-0.164, p=0.543).


