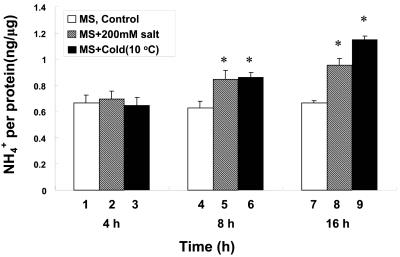
Figure 4.
Endogenous free ammonium content increases under stress treatments. Samples were harvested as described in Figure 3. Free ammonium content was assayed as described in “Materials and Methods.” Each bar represents an average of five samples. Error bars = ses. The data was analyzed by one-way analysis of variance (ANOVA) followed by lsd test. An asterisk indicates significant difference when compared NaCl-(lanes 2, 5, and 8) and cold-(lanes 3, 6, and 9) treated samples to untreated controls (lanes 1, 4, and 7), with a P value less than 0.05.

