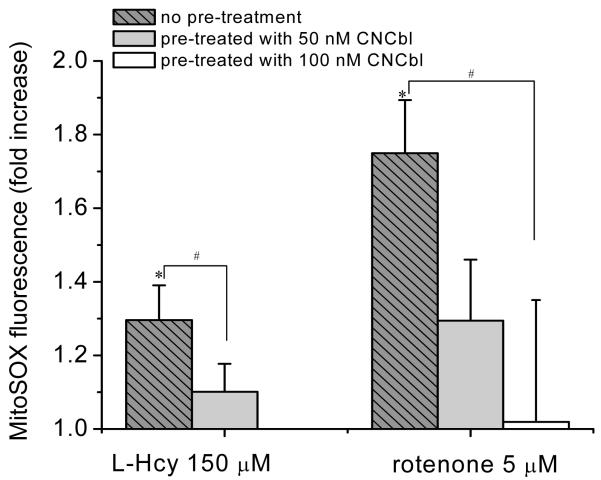
Figure 5. Subcellular localization of Hcy-induced oxidative stress.
HAEC were incubated in the absence or in the presence of CNCbl (50 nM or 100 nM) for 24 h. HAEC were washed and exposed to L-Hcy (150 μM, 24 h) or rotenone (5 μM; 1 h). Mitochondrial O2•− was detected by quantifying mitoSOX fluorescence in a microplate reader (λex/em = 510/580 nm). Data are expressed as mean ± SEM; N ≥ 4; * p < 0.05 compared to control, # p < 0.05.

