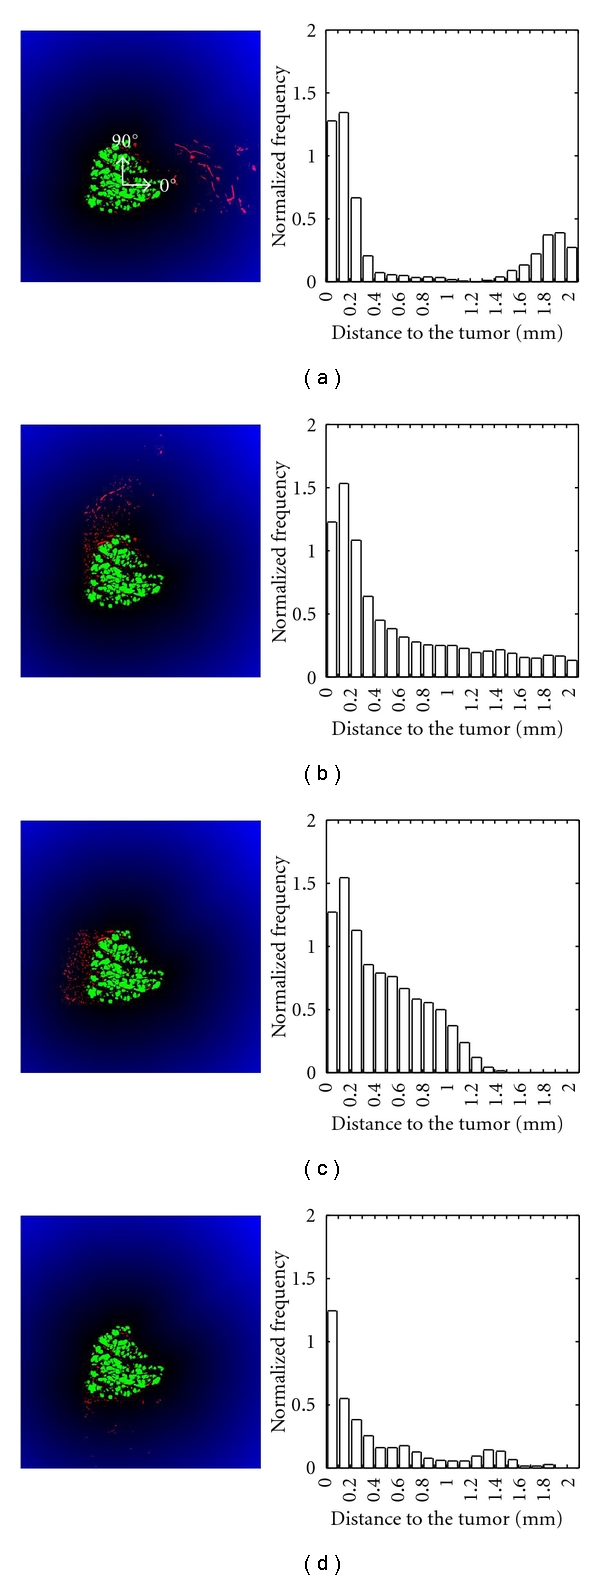
Figure 5.

Euclidean distance function applied to the region of interest around the tumor. Vessels (in red) oriented at 0° (a), 90° (b), 180° (c) and 270° (d) are shown on the left (green = tumor cells). The histograms on the right correspond to the vessel distribution (normalized frequency) as a function of the distance to the closest tumor nodules (mm).
