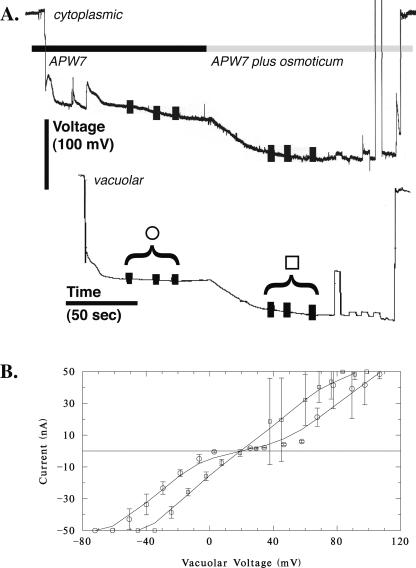
Figure 4.
Vacuolar current-voltage relations: hyperosmotic effect. A, An example of potential measurements from the cytoplasm and vacuole. Vertical bars on the potential traces show when voltage clamping was performed to obtain the current-voltage relation. B, Current-voltage measurements before (circles) and after (squares) hyperosmotic treatment. The data are mean ± sd of three measurements, as shown in A. High sds at positive voltages are due to a progressive increase in current during the measurements after hyperosmotic treatment. For all experiments, most of the current-voltage relations exhibited voltage-activated currents at negative and positive voltages (four of six experiments), or were linear. There was no systematic relation between the shape of the current-voltage curves and treatment (before and after).

