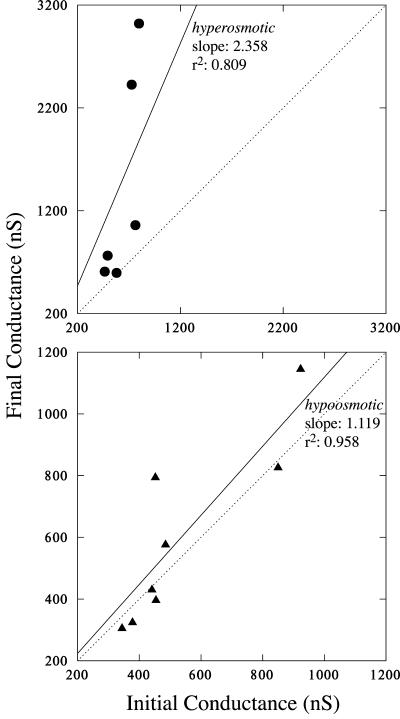
Figure 6.
Gv changes. Final Gv is plotted versus initial Gv. Linear regression (y = bx) was performed to evaluate changes caused by hyperosmotic (top) or hypo-osmotic (bottom) treatments. The dotted diagonals show the expected relation if no change in Gv occurred (a slope of 1). For hyperosmotic treatment, Gv increased in all experiments. The increase was 2.36 ± 0.51 (slope ± se; P = 0.006). Even if the two largest Gv increases are removed from the dataset, the Gv increase (1.32 ± 0.10) is still highly significant (r2 = 0.982, P = 0.001). For hypo-osmotic treatment, most data clustered about the diagonal, below or above, the slope was 1.12 ± 0.09 (P < 10-3).

