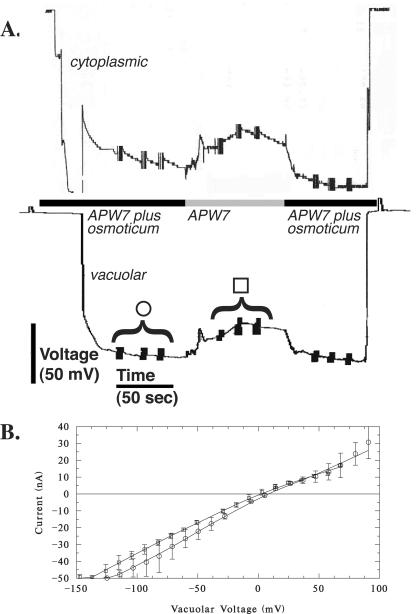
Figure 7.
Vacuolar current-voltage relations: hypo-osmotic effect. A, An example of potential measurements from the cytoplasm and vacuole. Vertical bars on the potential traces show when voltage clamping was performed to obtain the current-voltage relation. B, Current-voltage measurements before (circles) and after (squares) hypo-osmotic treatment. The data are mean ± sd of three measurements, as shown in A. The current-voltage relations are linear in this example (with slight current activation at negative voltages). In other experiments, currents exhibited voltage activation at positive and negative voltage (five of nine experiments), or only at negative voltages (two of nine experiments). There was no systematic relation between the shape of the current-voltage curves and treatment (before and after).

