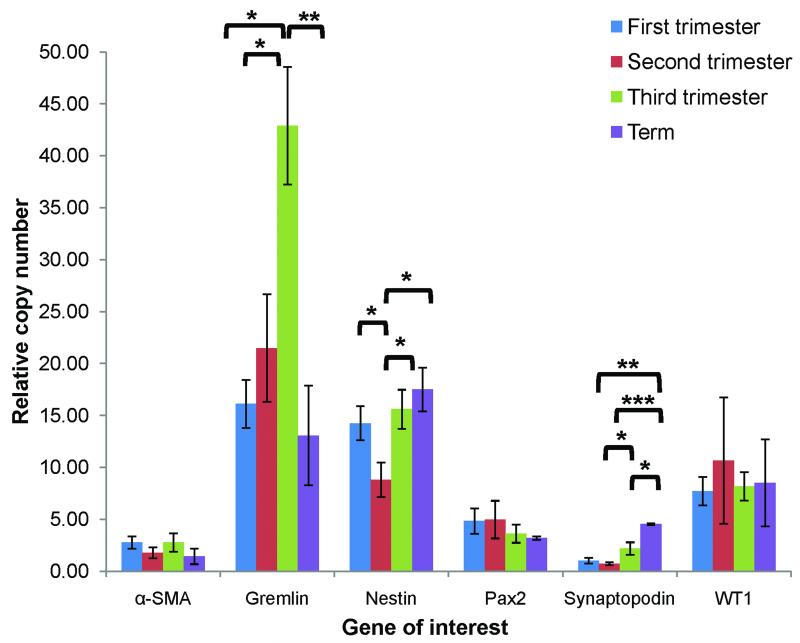
Figure 7. Quantitative RT-PCR analysis of expression patterns of α-SMA, Gremlin, Nestin, Pax2, Synaptopodin, and WT1 across gestation.
RNA expression was quantified according to the comparative CT method with EF1-α as the housekeeping gene and relative changes in expression determined by comparison to adult mRNA taken as 100% (see text); *p<0.05, **p<0.01, ***p<0.001. An N≥3 was included for each age group.

