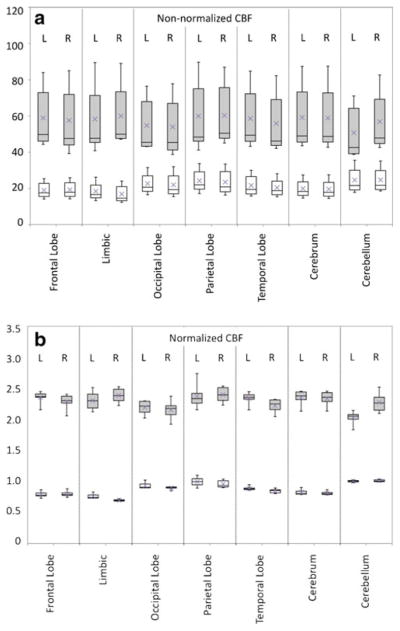
Fig. 2.
Box plots showing intrasubject variation of measurements of CBF in various lobar regions of each cerebral hemisphere after registration using the Talairach atlas, a without and b with normalization against mean CBF of the cerebellar WM. Each box encompasses the first to third quartiles, with error bars marking the full range of values, horizontal bar representing the median and x denoting the mean. GM is depicted in gray, and WM in white. From all regions, the absolute mean CBF of the cortical GM is 57.67±18.68 and of the WM 21.24±5.95. Average nCBF of the GM is 2.54±0.18 and of the WM 0.94±0.04

