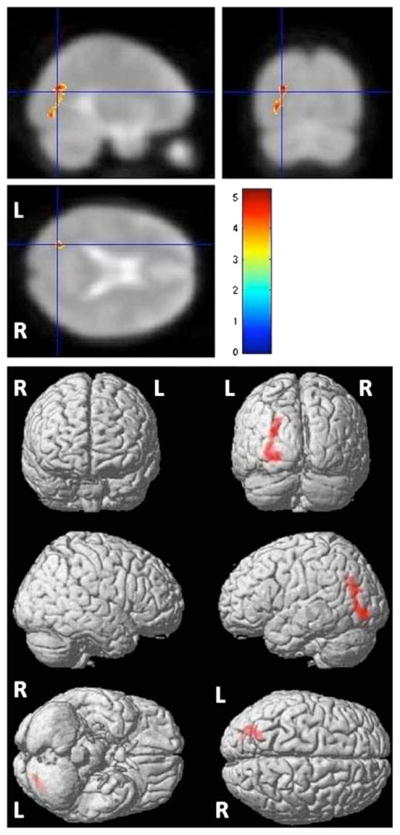
Fig. 3.

Statistical parametric map of regional increased perfusion after Ginkgo administration (uncorrected P≤0.005). The red region representing hyperperfusion is localized to the left parietal–occipital WM. This result was demonstrated only in the “pre≤post” design matrix based on paired t test. The intensities of color-coding in the 3D rendering are weighted sum of t values, where the weights are proportional to the depth within the brain; that is, deeper regions will be shown with less intensities
