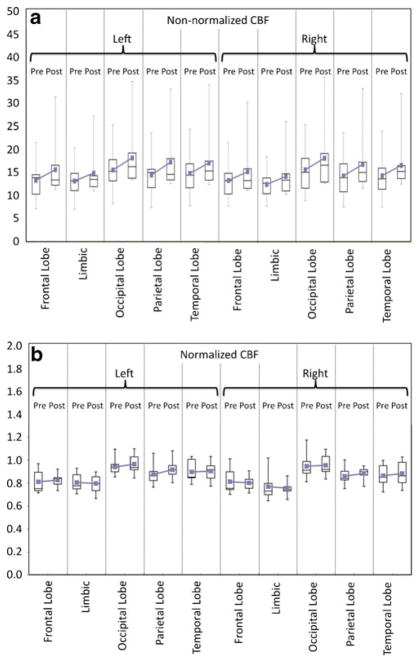
Fig. 4.
Box plots showing CBF values in various segmented lobar WM regions before and after Ginkgo administration: (a) non-normalized CBF values, (b) CBF values normalized to cerebellar WM CBF (nCBF). In all lobar regions (including cerebellum), there is a general trend of higher mean and median absolute CBF values after Ginkgo administration; however, this is not statistically significant when corrections for multiple comparisons are performed. This trend is not consistently observed after normalization, but still holds in more than 50% of the regions. If correction for multiple comparisons is not performed, a single ROI of the left occipital and parietal WM region shows significantly increased CBF and nCBF post-Ginkgo (see text)

