Figure 10.

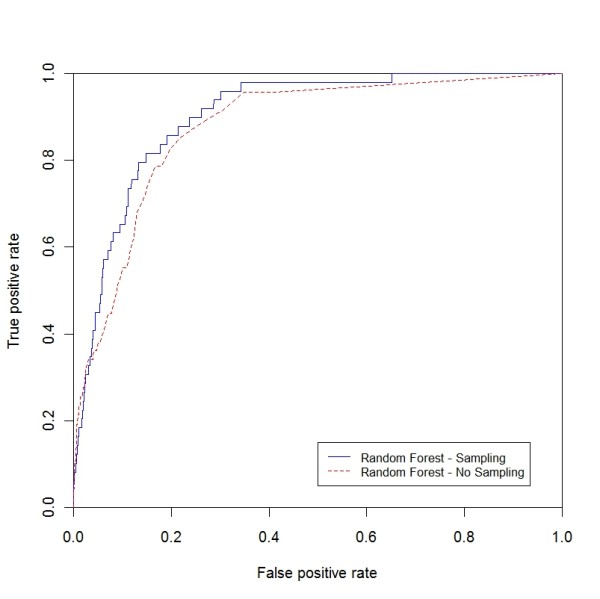
ROC curve for peripheral atherosclerosis (sampling vs. non-sampling). ROC curve for peripheral atherosclerosis comparing RF with the sampling and non-sampling approach.

ROC curve for peripheral atherosclerosis (sampling vs. non-sampling). ROC curve for peripheral atherosclerosis comparing RF with the sampling and non-sampling approach.