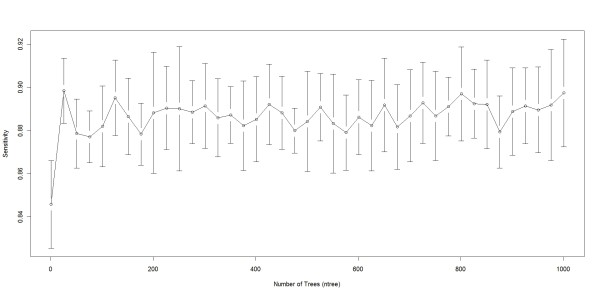
Figure 4.
RF behaviour when the number of trees (ntree) varies. This plot shows how sensitivity in RF varies as the number of trees (ntree) varies, we varied ntree from 1-1001 in intervals of 25 and measured the sensitivity at every interval. Sensitivity ranged from 0.8457 when ntree = 1 and 0.8984 when ntree = 726. In our experiments we used ntree = 500 since the ntree did not have a large affect on accuracy for ntree >1.

