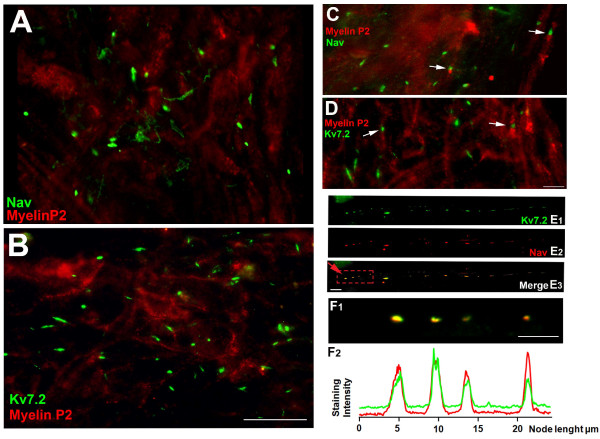
Figure 5.
Abnormal expression of Nav and Kv7.2 channels in distal neuromas. A and B are medium scale magnification fields obtained from distal areas of the neuroma. In both instances there is a clear lack of structure and myelin loss. In addition, large accumulations of Nav and Kv7.2 channels are shown in A and B respectively. C and D contain field images of transition areas in which normal nodes (marked by arrows) are detected close to larger accumulations of Nav (C) or Kv7.2 (D). E shows the co-staining of Nav and Kv7.2 in a dotted line-like structure, probably an indication of a demyelination/remyelination process within the same fiber. F1 shows several individual nodes at a high magnification (contained in red square in E3). The corresponding immnofluoresce intensity profiles are shown in F2. Scale bars: for A and B, 20 μm (shown in B); C and D, 5 μm (shown in D); for E, 5 μm (shown in E3) and for F1, 5 μm.

