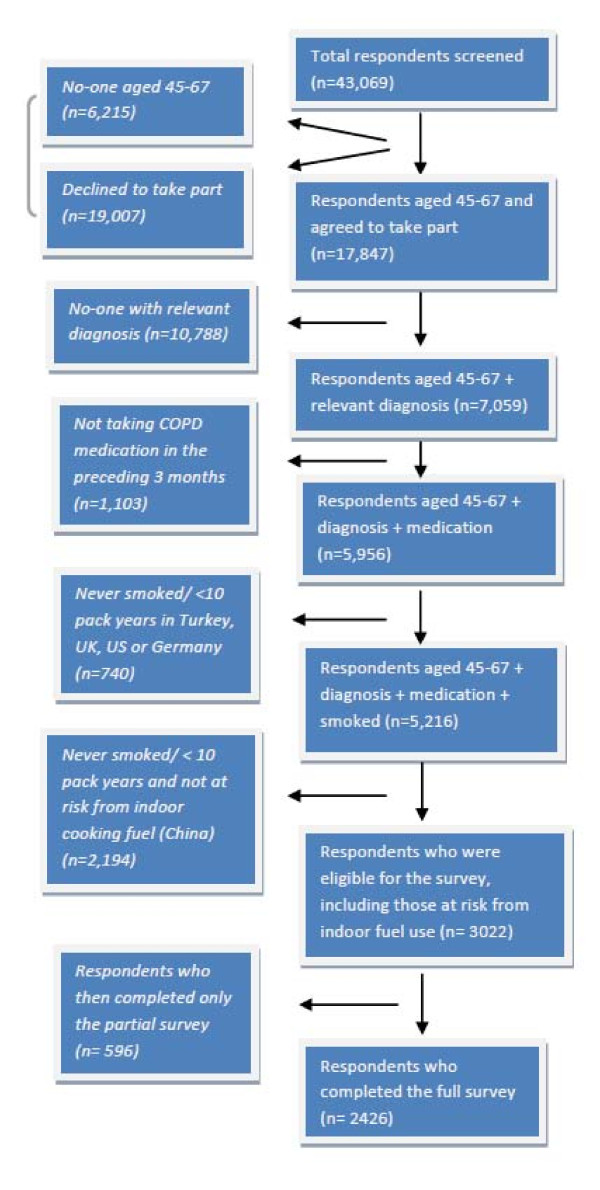
Figure 1.
CONSORT diagram showing recruitment of study participants. The CONSORT diagram shows the number of people involved at each stage of the survey recruitment process, according to the study criteria. Where a particular individual did not fulfil a particular criterion, they were not included in the study, and where such instances occurred, this is reflected along the left hand side of the figure. The right hand side reflects those included at each stage of the process, including the number of people [n]. The final figure included the respondents completing the full survey.

