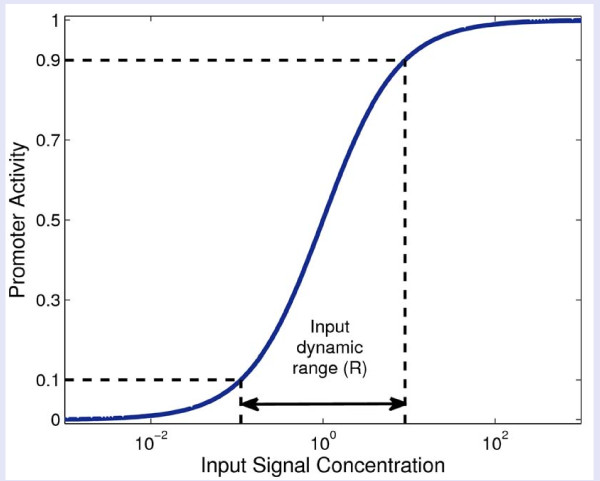
Figure 2.
Gene input function and its input dynamic range. The input function is defined as the normalized promoter activity at different signal concentrations. The black horizontal dashed lines mark the 10% and 90% promoter activity. The input dynamic range is the ratio R of input concentrations required for 90% and 10% of maximal output.

