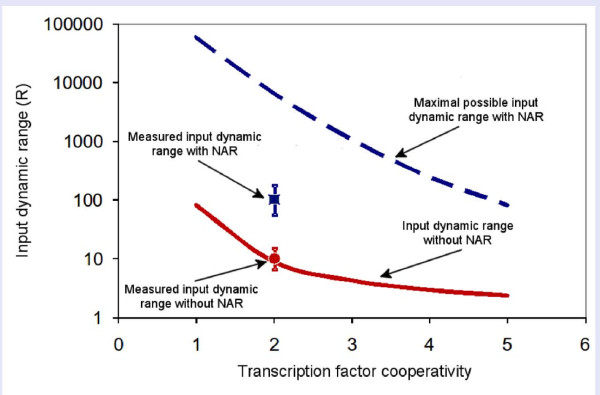
Figure 5.
NAR model suggests increased input dynamic range for regulators with varying degrees of cooperativity. Cooperativty of the regulator is described by a Hill coefficient for the binding of TF to its downstream promoter. Dashed blue line is the maximal possible input dynamic range that can be reached by a system with a negatively auto-regulated TF, as found by scanning the entire range of model parameters. Solid red line is the input dynamic range that the system displays without negative auto-regulation, given by R = 81(1/n). The blue square and red dot are the experimentally measured input dynamic ranges of araBAD with and without NAR, respectively.

