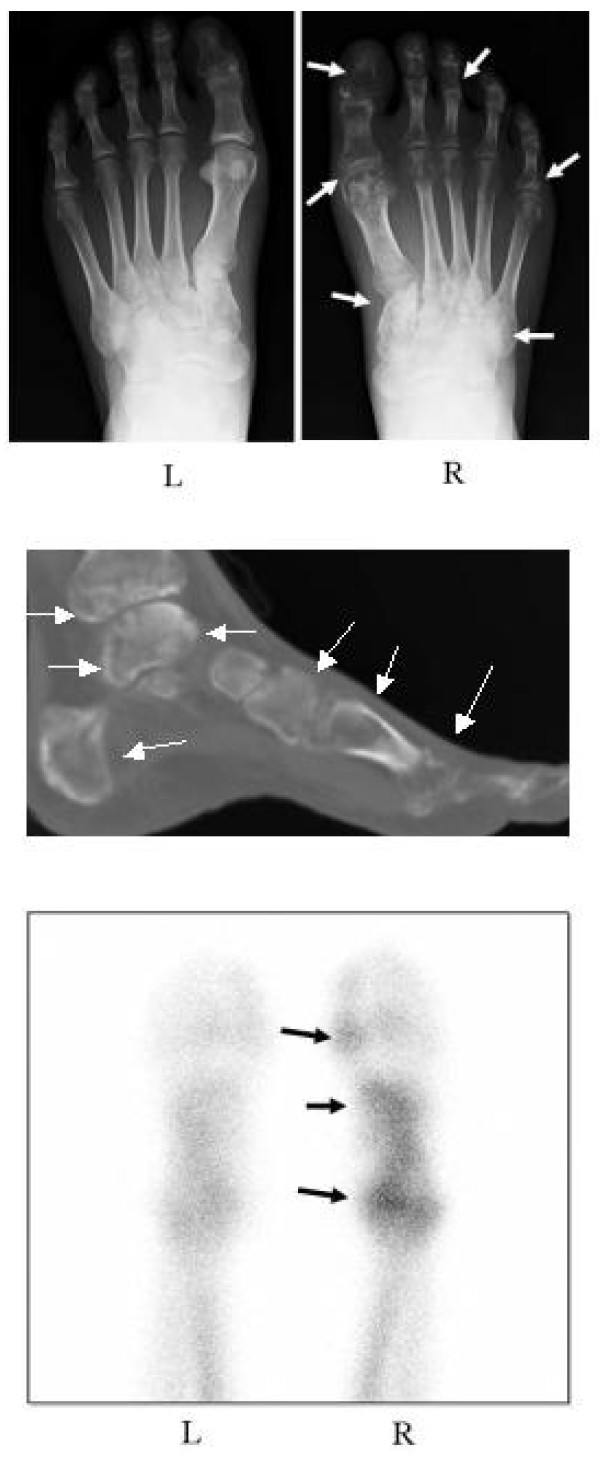
Figure 5.
Radiograph (A), reconstitution computed tomography (CT) image (B), and scintigraph (C) of the both feet before treatment. The radiograph shows regional osteoporotic changes in the phalanges, metatarsals, and tarsals of the right foot compared with the normal, left foot (white arrow) (A). Reconstitution CT image exhibits the extensive osteoporotic changes in the foot and ankle (white arrow) (B). Bone scintigraphy with 99 mTc-methylene diphosphonate shows a marked increase in radioactivity in the right foot (black arrow) (C).

