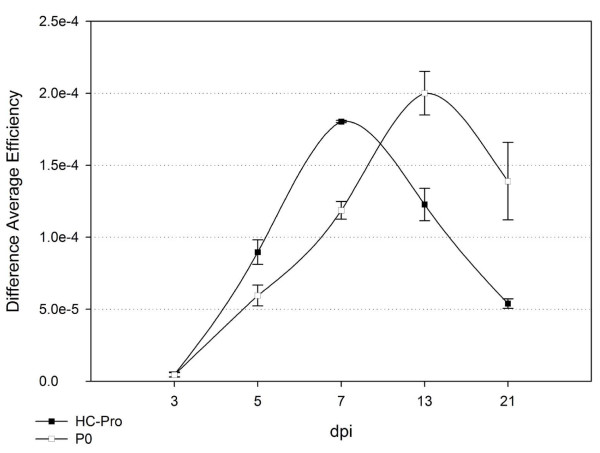
Figure 4.
PPV HC-Pro and BMYV-IPP P0 suppressor activity at 3, 5, 7, 13 and 21 dpi. Diagram showing the mean difference in average efficiency of control (pBinGFP/pBin) and pBinGFP/pBinHCPro (black square) or pBinGFP/pBin P0 (white square) agroinoculated GFP-transgenic leaf patches at 3, 5, 7, 13 and 21 dpi. Differences were calculated for each individual leaf and then combined as mean difference of average efficiency. The standard error is indicated and the number of samples (n) per time point was as follows (HC-Pro/P0): 3 dpi (n = 7/14), 5 dpi (n = 13/17), 7 dpi (18/18), 13 dpi (8/8) and 21 dpi (9/6).

