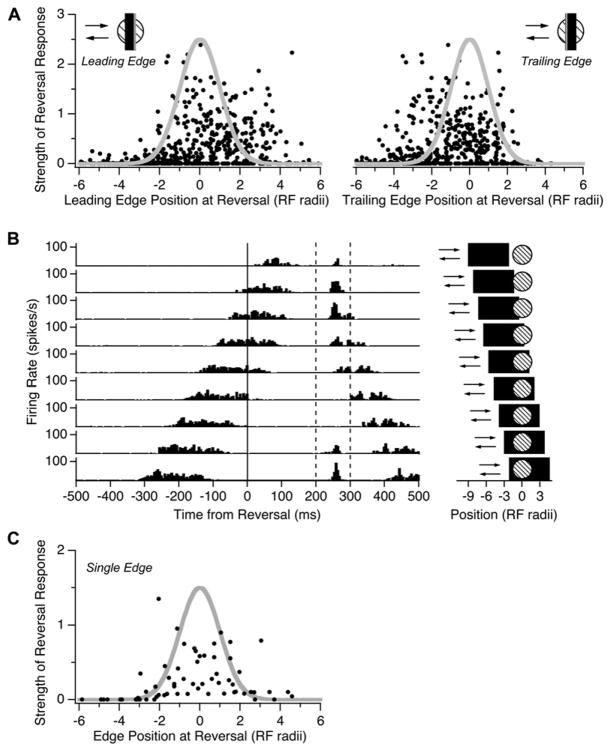
Figure 3. Dependence of the Response on Reversal Location.
(A) (Left) Peak firing rate of the reversal response normalized by the peak firing rate during smooth motion and plotted against the distance of the bar’s leading edge from the receptive field center coordinate, xi, at the time of reversal (n = 108 cells, 338 total positions). Distances are expressed in units of the center radius of each cell, σi. (Right) Same data but with distances measured with respect to the location of bar’s trailing edge at the time of reversal.
(B) Firing rate of a single ganglion cell during motion reversals of a wide (440 μm) bar at different locations (pictograms on the right). Dashed lines show the time window in which reversal responses were observed.
(C) Normalized peak firing rate at time of reversal plotted against the distance of a single-contrast edge from the receptive field center (n = 8 cells, 88 total positions).

