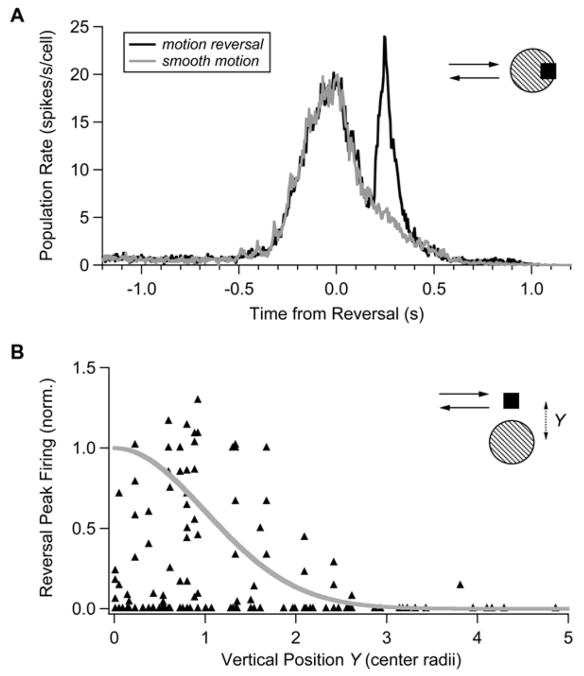
Figure 4. Ganglion Cell Responses to Reversing Squares.
(A) Population average firing rate for responses to a smoothly moving square (gray; speed = 1.32 mm/s) and a reversing square (black; n = 16 cells at a total of 75 reversal positions).
(B) Peak firing rate of the reversal response as a function of the vertical distance, Y, between the center of the square and a ganglion cell’s receptive field center coordinate, xi, expressed in units of the center radius, σi. Firing rate was normalized by the peak firing rate for smooth motion of the square. Gaussian spatial profile is shown in gray.

