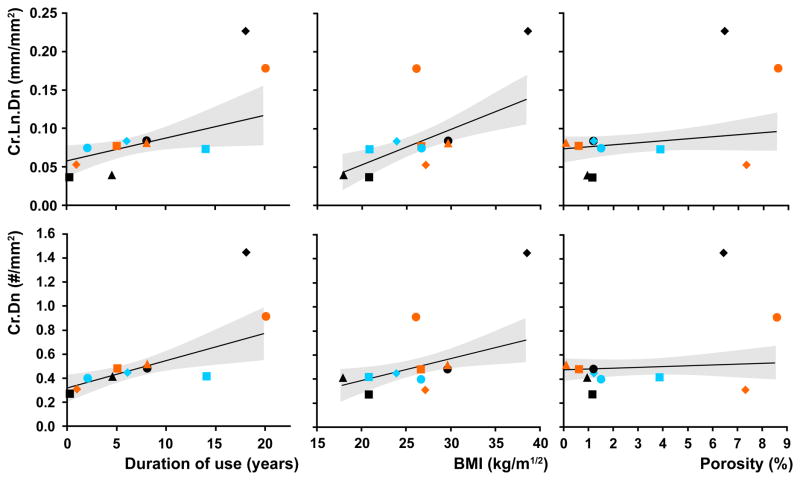
Figure 3.
Bivariate plots of cement damage (top Cr.Dn, bottom Cr.Ln.Dn) versus duration of use, BMI and porosity fraction. The plots are overlaid with the profiles of the regression models (solid lines) along with 95% confidence intervals (dashed lines). Results of the multiple regression analyses are shown in Table 2.

