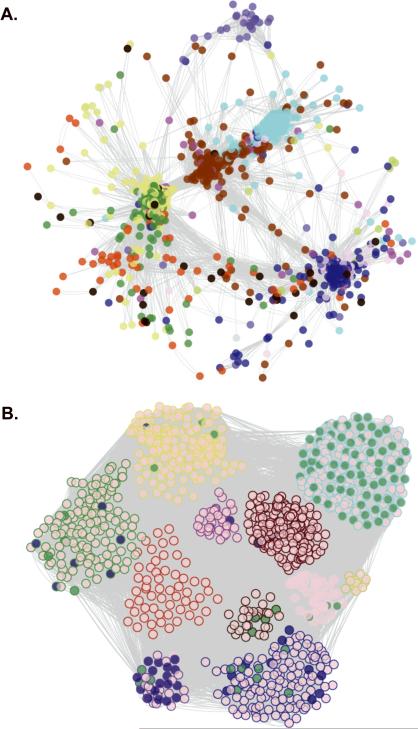
Figure 1. Visualization and Functional Enrichment of the HAEC Gene Co-Expression Network.
In the whole network, 2000 transcripts were organized into 11 modules. The number of module transcripts were: black (93), blue (299), brown (292), green (205), greenyellow (40), magenta (78), pink (82), purple (52), red (158), turquoise (373), yellow (270). The grey module had 58 genes but was not considered a real module. For ease of visualization, the 1090 most connected network transcripts (topological overlap scores > 0.9035) are shown. Circles (nodes) represent genes and lines (edges) represent topological overlap (similar to correlation) between transcript pairs. A. Genes are arranged by topological overlap, so that small distances indicate high correlation and node colors indicate module membership. B. Module membership is indicated by the node outline color and functional enrichment is illustrated by the node fill color. Transcripts belonging to the cell cycle pathway are shaded in green, while ER stress genes (translational initiation, response to unfolded protein, response to ER stress, and protein folding) are shaded in blue. Nodes were arranged manually in B according to module membership.

