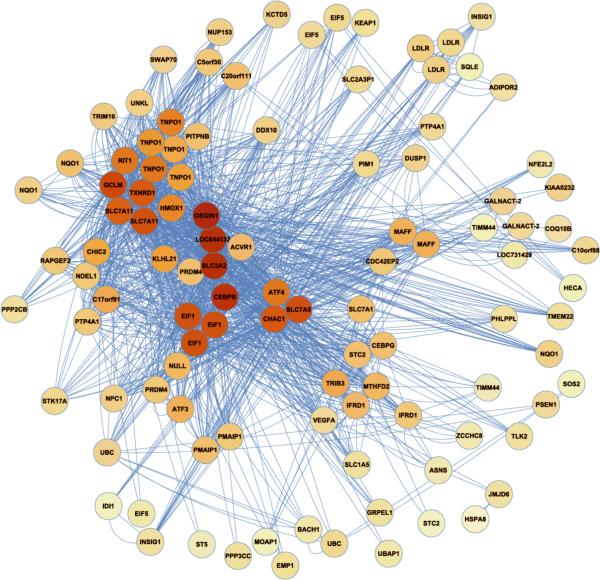
Figure 2. The Blue Module.
Transcripts (nodes) are shaded by the degree of intra-modular connectivity, where red is the most connected (i.e. `hubs'). Lines connecting the transcripts (`edges') signify co-expression. This is a simplified view of the blue module. Refer to Online Figure II for a more thorough representation.

