Figure 2.


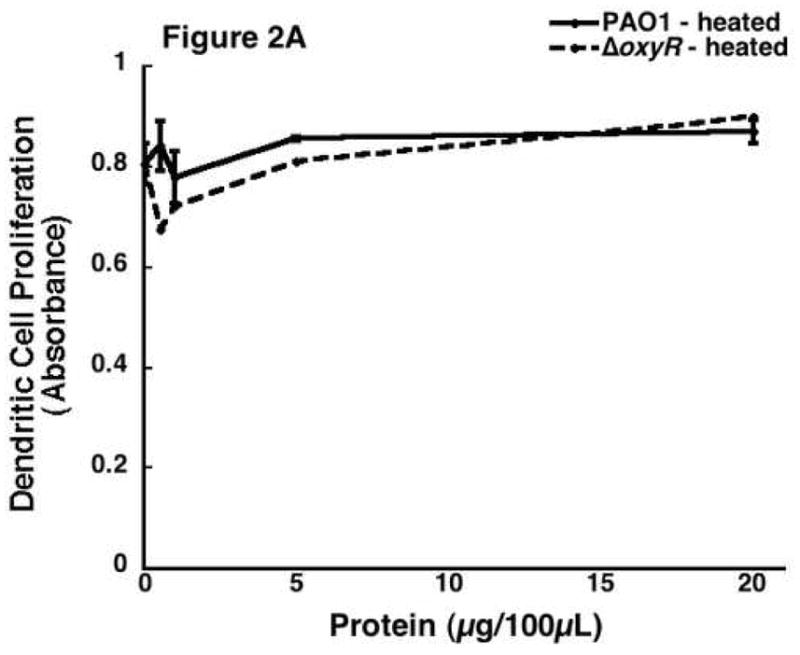
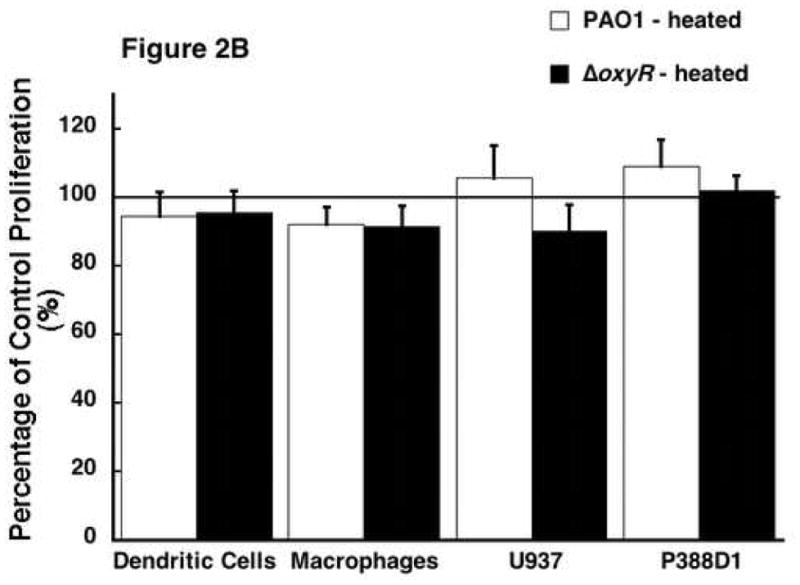
The effect of heat inactivated Pseudomonal supernatant protein on cellular proliferation. Bacterial protein was heated to 85 °C for 10 minutes then applied to all four cell lines. A) A dose response curve from a representative sample of ER-MP20+ progenitor derived DC. PAO1 (solid line) and ΔoxyR (dashed line) are shown as absorbance vs. concentration of bacterial protein. Data is represented as the mean (N=3) ± the standard deviation. B) Graphical representation of heat inactivated PAO1 protein (white bar) vs. ΔoxyR protein (black bar) for all four cell lines at 5 μg/100 μL. The numbers are the mean (N=3) ± standard deviation.
