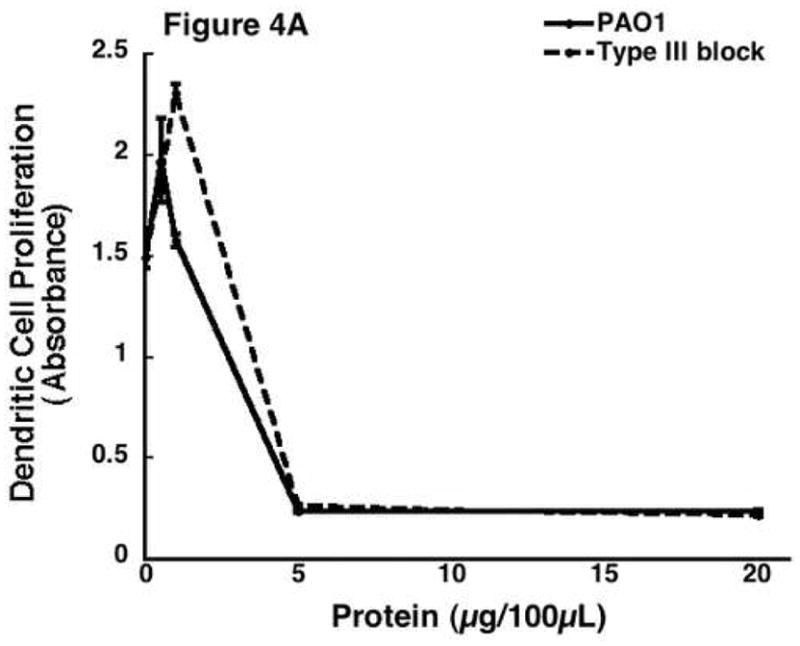
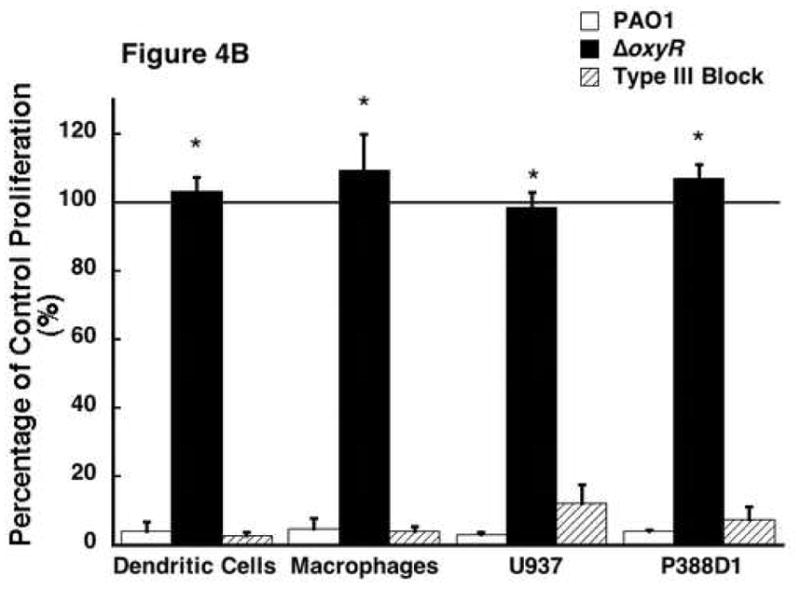
Figure 4.


The effect of supernatant protein from secretion deficient Pseudomonas on cellular proliferation. Supernatant protein was isolated from P. aeruginosa blocked through a repressor gene (type III block). The protein was then added to all four cell lines as previously described. A) A dose response curve from a representative sample of ER-MP20+ derived DC plotting PAO1 (solid line) and type III block (dashed line) as absorbance vs. protein concentration. Data is represented as the mean (N=3) ± the standard deviation. B) Graphical representation of cellular proliferation for all four cell lines when treated with PAO1 (white bar), ΔoxyR (black bar), and type III block (dashed bar) supernatant protein at 5 μg/100 μL. The numbers are the mean (N=3) ± standard deviation. * p < 0.05 for PAO1 vs. ΔoxyR for all four cell lines.
