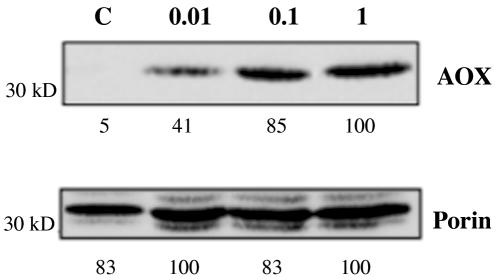
Figure 3.
Effect of SA on the expression of mitochondrial proteins. Cells were treated with SA for 24 h, after which total proteins were extracted and mitochondrial proteins detected by western blotting. C, Control cells (no added SA); 0.01, 0.01 mm SA; 0.1, 0.1 mm SA; 1, 1 mm SA. Signal intensities were quantified and expressed relative to the maximal value as shown by the numbers below each blot.

