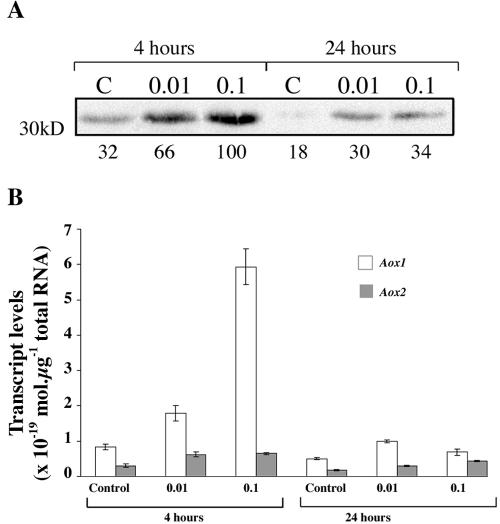
Figure 4.
Effect of SA on the expression of Aox protein and transcripts. Cells were treated with SA at different concentrations and protein and RNA extracted after 4 and 24 h. A, Aox protein. Lanes C, Controls (no added SA); lanes 0.01, 0.01 mm SA; lanes 0.1, 0.1 mm SA. Cells were harvested after 4 or 24 h, and Aox protein was detected by western blotting. The numbers under the blots represent quantification of the signal intensity and are expressed relative to the maximum. B, Transcript levels for NtAox1 and NtAox2. Two independent samples from each of the treatments (control, 0.01 mm SA, and 0.1 mm SA) at both 4 and 24 h after SA addition were used for RNA isolations. From each RNA sample, two preparations of cDNA were produced and used in real-time quantitative PCR to determine transcript levels of the two Aox isoforms. Each cDNA sample was analyzed in duplicate for each isoform. Absolute transcript levels were determined using a standard curve prepared using known concentrations of amplified regions of the Aox1 and Aox2 cDNA. Error bars show the se calculated for each treatment.

