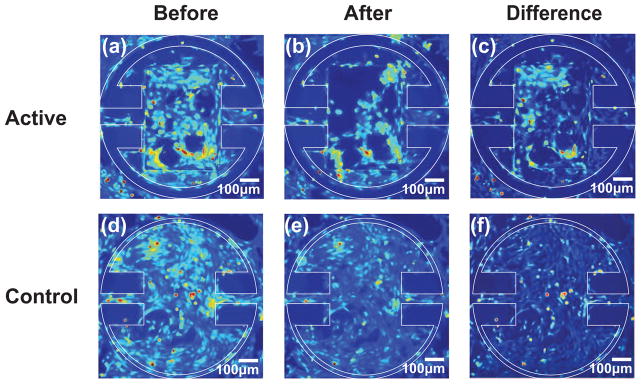
Figure 15.
Images of a round magnetic microactuator with 100-μm-wide torsion beams, 350×500×7 μm3 magnet volume, and a 40-μm-wide gap taken (a) before actuation and (b) after actuating for 30 min at 100 Hz in a magnetic field of 17.8 kA/m. The difference map showing the areas where cells were cleared is shown in (c). Control devices with 60-μm-wide torsion beams and a 5-μm-wide gap were imaged (d) before actuation and (e) after actuating for 30 min at 100 Hz in a magnetic field of 17.8 kA/m. The difference map is shown in (f). Note that actuation of magnetic devices has reduced the overall cellular density, particularly in the top left corner (c) of the actuator.

