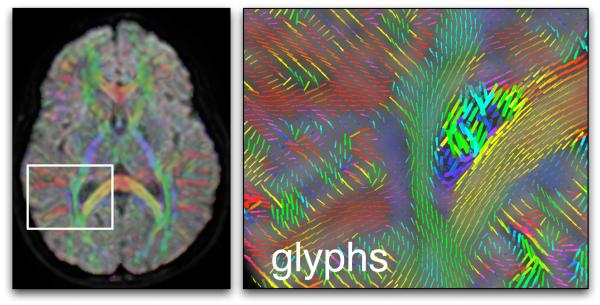
Figure 5.
An example using glyphs and colors for DTI visualization. On the left an axial image plane, showing the average diffusion-weighted image with semi-transparent color overlay indicating the major eigenvector orientation, and a white square indicating the zoomed-in area (right image). In both images the color red indicates right-left orientation, blue is superior-inferior, and green is anterior-posterior. The right image contains glyphs representing major eigenvector orientations (and scaled by the largest eigenvalue) in the region of the corpus callosum (yellow and red) and right lateral ventricle. The cingulum can be seen in blue, and the posterior limb of the internal capsule in green.

