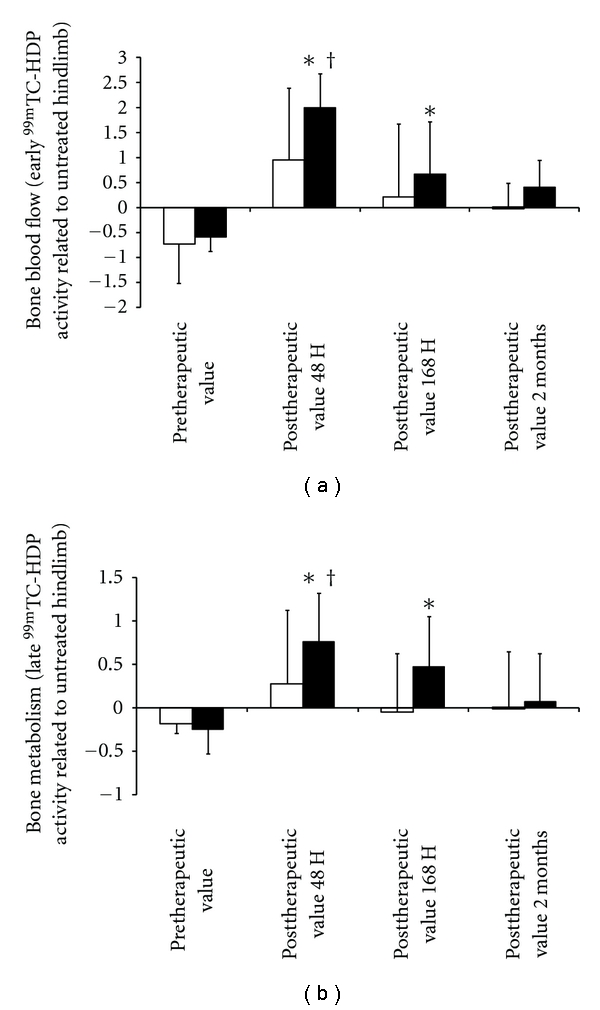
Figure 5.

Two-month evolution of bone flood flow (a) and bone osteoblastic metabolism (b) in irradiated tibias treated with BMSCs (dark columns) and control (white columns), values being expressed as relative to baseline (% of uptake variations with regard to untreated hindlimb values). *P < 0.05 versus pretherapeutic data, †P < 0.05 versus control group.
