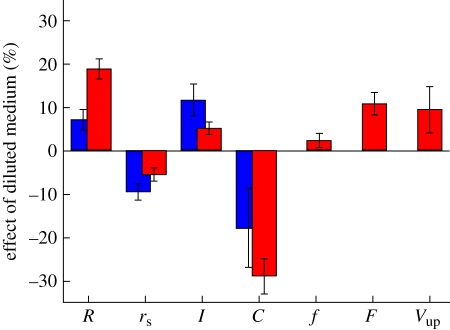
Figure 4.
Bar chart showing the percentage changes of properties of V. carteri colonies grown in diluted medium, with respect to those grown in normal medium. The two colours indicate results from the different experiments: table 1 in blue (1000 fc), and table 2 in red (600 fc). Error bars show the standard error. The symbols used are the spheroid radius R, somatic cell radius rS, flagellar length l, somatic cell concentration C, flagellar frequency f, net force of flagella on the fluid F, and the upward swimming speed Vup.

