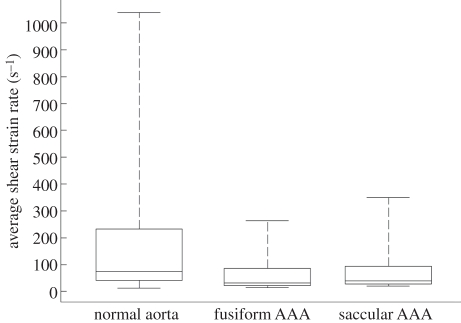
Figure 10.
Distribution of the scalar shear rate  in the normal aorta, fusiform AAA and saccular AAA represented by box (lower and upper quartiles) and whisker (minimum and maximum) plots. Data were collected from the last cardiac cycle (200 data points) and averaged over the entire simulation domain. The normal aorta showed the highest maximum value, corresponding to peak systole, owing to the restricted lumen with respect to the other cases. The saccular AAA showed a higher maximum compared with the fusiform AAA owing to the smaller outlet sections and to the influence of the aortic section resembling a healthy vessel, figure 2.

