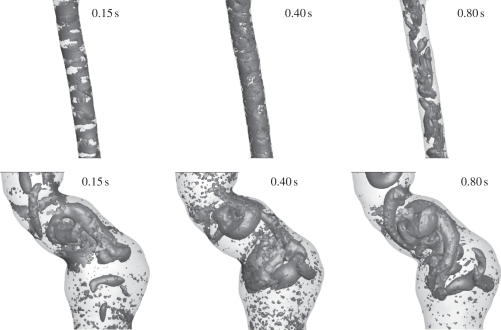
Figure 7.
Evolution of vortical structures (VSs) in a normal aorta (top row) and in the fusiform abdominal aortic aneurysm (AAA) (bottom row) and a saccular AAA (bottom row) during the cardiac cycle. Simulations were based on the Carreau–Yasuda model and VSs were educted by the λ2-method using a threshold value of λ2 tr = −20.0 s−2.

