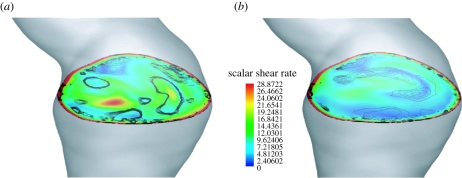
Figure 9.
Local differences of the results as predicted by (a) the Newtonian and (b) the Carreau–Yasuda model. Images show the colour-coded scalar shear rate  at a selected plane in the abdominal aortic aneurysm (AAA) at peak systole (0.2 s) overlaid by the contours of vortical structures (VSs). VSs were educted with the λ2-method using threshold values of −20.0 s−2 ≤ λ2 tr ≤ 0.

